

One of the principal modelling tools used within Precision Acoustics is a comprehensive finite difference simulation.
A critical feature of many design processes is the ability to simulate the problems before undertaking the more costly stage of prototype fabrication. One of the principal modelling tools used within Precision Acoustics is a comprehensive finite difference simulation.
It is capable of predicting the simulation full acoustic wave simulation through both solid and fluid media. This means that the propagation of longitudinal, shear, Love, Lamb, Rayleigh and Stoneley wave can all be simulated. Simulations can either be conducted in 2D Cartesian or 3D axi-symmetric cylindrical co-ordinates with either lossless and/or simple lossy materials.
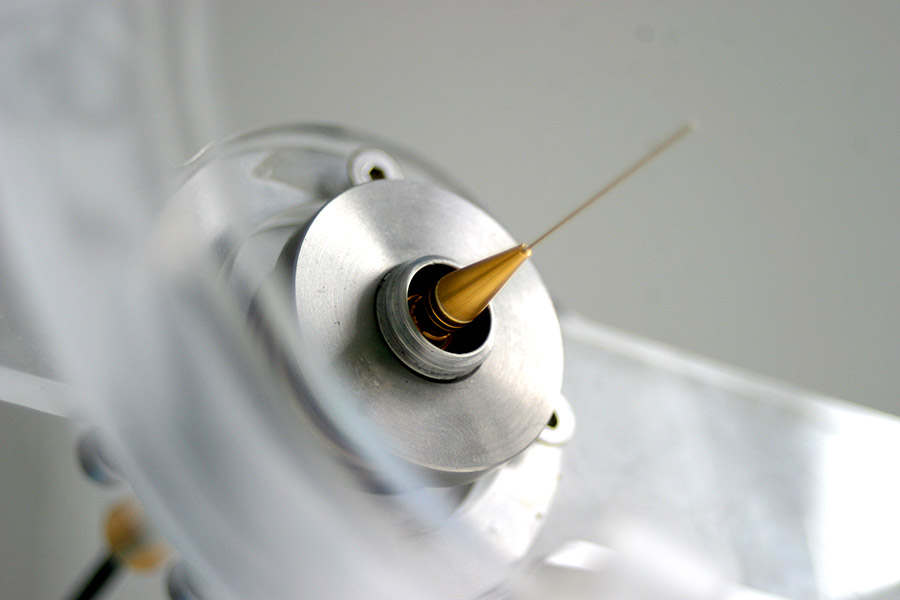
Application of the numerical model has been critical in the improvement of the frequency response of the Precision Acoustic needle hydrophone range. Historically, needle hydrophones had a very non-uniform frequency response at lower frequencies. A typical needle geometry was simulated and the radial interactions of waves diffracted from the edges of the needle tip could clearly be seen.
The geometry of the needle hydrophone tip was then modified in the simulation and when a satisfactory solution was obtained, this was then implemented on a revised design for the needle hydrophone. This process has been so successful that all Precision Acoustics needle hydrophones now incorporate the modifications suggested by the numerical simulations.
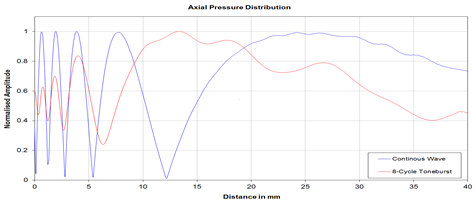
During one of our hydrophone user courses, Precision Acoustics were asked “Why does the last axial maxima of my transducer appear in a different position when I drive it with a toneburst?”
Clearly this relates to the interaction of plate and edge waves from the transducer, but the explanation of this phenomenon was easiest explained with the assistance of some numerical simulations.
The animations below display the same transducer drive with either CW or an 8-cycle toneburst whilst the graph displays the axial pressure maps derived from these simulations.
This software, the AFiDS suite, has been developed by Dr. Andrew Hurrell over 10 years, and has been the subject of several conference presentations.
If you are interested in accessing our simulations services using AFiDS, please contact us using the enquiry form below.
If you would like more information, please get in touch by phone, email or enquiry form.
Alternatively complete our enquiry form below.
Telephone:
Email:
| Cookie | Duration | Description |
|---|---|---|
| cookielawinfo-checkbox-analytics | 11 months | This cookie is set by GDPR Cookie Consent plugin. The cookie is used to store the user consent for the cookies in the category "Analytics". |
| cookielawinfo-checkbox-functional | 11 months | The cookie is set by GDPR cookie consent to record the user consent for the cookies in the category "Functional". |
| cookielawinfo-checkbox-necessary | 11 months | This cookie is set by GDPR Cookie Consent plugin. The cookies is used to store the user consent for the cookies in the category "Necessary". |
| cookielawinfo-checkbox-others | 11 months | This cookie is set by GDPR Cookie Consent plugin. The cookie is used to store the user consent for the cookies in the category "Other. |
| cookielawinfo-checkbox-performance | 11 months | This cookie is set by GDPR Cookie Consent plugin. The cookie is used to store the user consent for the cookies in the category "Performance". |
| viewed_cookie_policy | 11 months | The cookie is set by the GDPR Cookie Consent plugin and is used to store whether or not user has consented to the use of cookies. It does not store any personal data. |
We will be closed from 5 pm on Thursday, 2nd April, until 8.30 am on Tuesday, 7th April.